GGU-GEO-GRAPH
 GGU-GEO-GRAPH
Management and visualisation of monitoring data with a focus on the spatial component
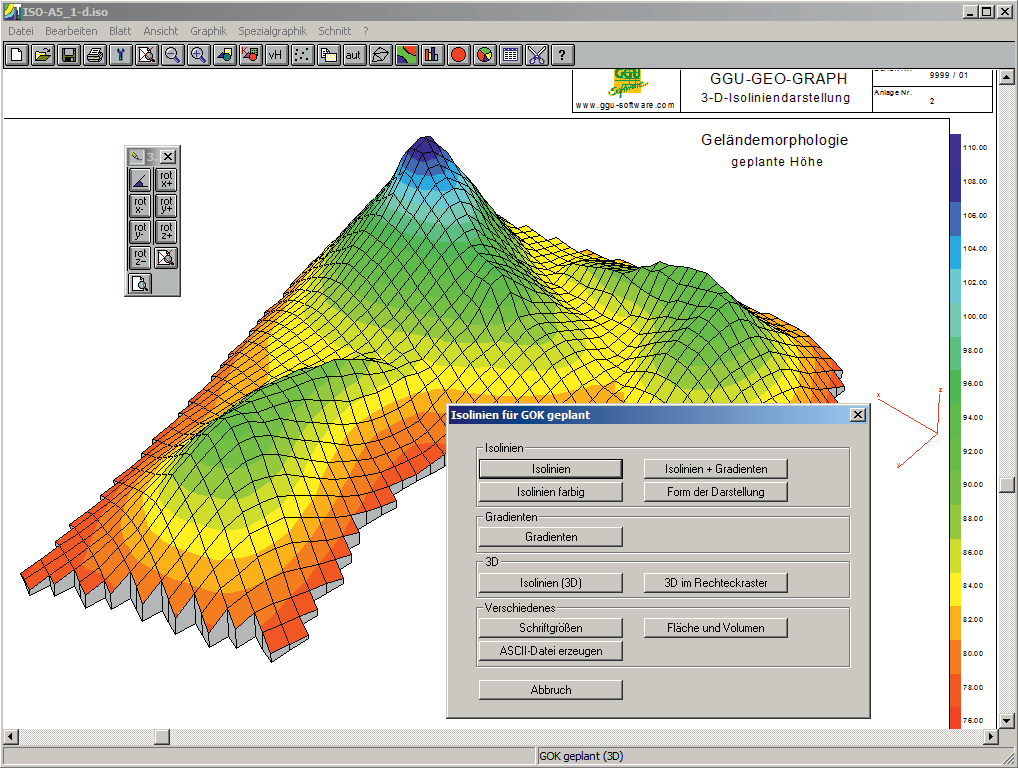
The monitoring data can be displayed in the following position orientated graphics:
- Contour lines
- Colour filled contours
- Colour filled 3D graphics
- Bar charts (linear, logarithmic, root scale)
- Bar charts (stacked)
- Pie charts
- Circle charts
- Symbolic charts
- Tables
Capabilities:
- Point input using Editor or mouse click
- Import ASCII files, e.g. tachymeter data
- Subsequent editing of all coordinates, e.g. displacement of all points by the same value
- Subsequent editing of all monitoring data, e.g. via factor input
- Link data, e.g. difference formation
- Interpolation of points and corresponding monitoring data, e.g. before and after ground raise
- Bar charts: linear, logarithmic, root scale, stacked
- Bar and table charts with value-dependent colour fill (exceeding limits)
- Separately definable limit for each individual value
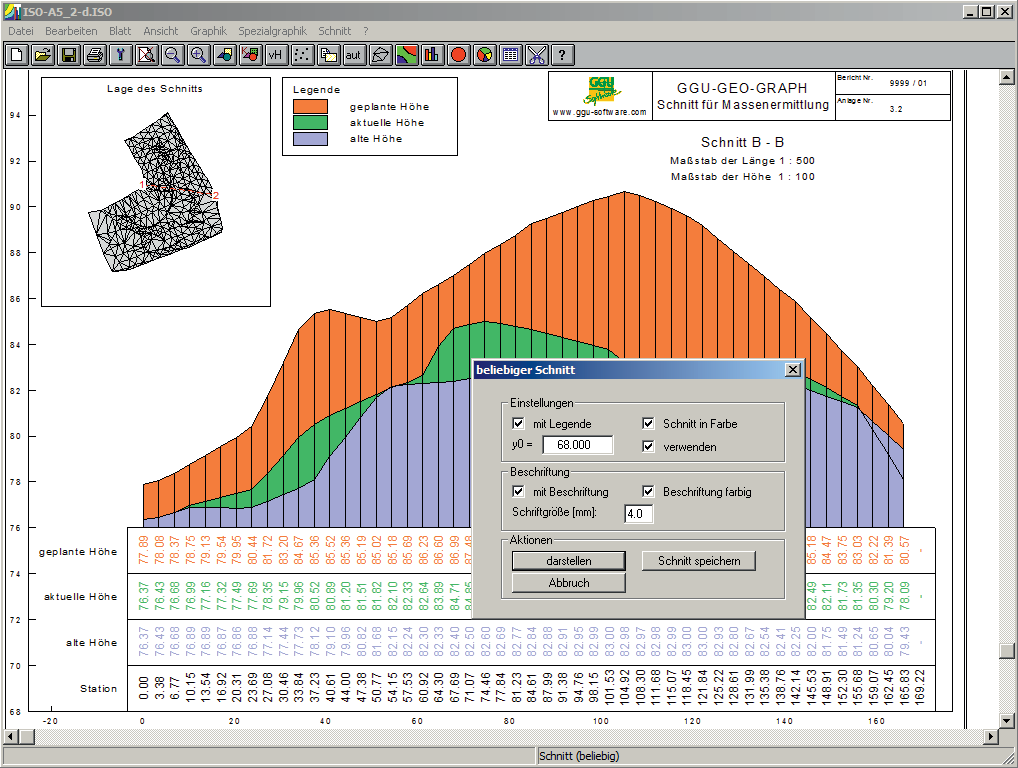
- Create sections for user-defined monitoring data
- Create sections graphically, using coordinates or along system nodes
- Section visualisation in colour, with or without labelling
- Free configuration of page format, image coordinates and scales
- User-defined graphic backdrops, e.g. topographic maps, drawings, photos
- Print or copy screen sections, e.g. for transfer to a word processor
- Integrated Mini-CAD system for additional annotation of graphics
Current updates & changes
8.0 (29.05.2026)
- Feature: Paid major update (Free for licensees with a subscription or update insurance under the software service agreement)
7.14 (28.01.2026)
- Feature: Automatic coordinate optimization for performance improvement
- Bug: Limited number of elements in FE programs
7.13 (27.08.2025)
- Bug: GEO-GRAPH - Bugfix: Special character error in "Elevation" from CONNECT Import
7.12 (29.04.2025)
- Bugfix - Missing example files after changeover to new installation process.
7.11 (23.04.2025)
- Groundwater heights from CONNECT Import also available as absolute heights.
- Offer layer thicknesses of subsoil layers and homogeneous areas with CONNECT import.
Show all entries
Online-Shop:
All prices incl. VAT
Information about our licenses
Simple and secure processing!
During the further order process you switch to the store system of our technology partners "WIBU Systems" and "cleverbridge". You can find out more about these companies under the following links.
 |  |
Additional information:
System preferences
GGU-Software runs on PCs with the following specifications:
- Pentium III or higher processor
- Microsoft Windows® (SAC), 11, Server 2016, 2019 and 2022 compatible
- 500 MB free hard disk space
- DVD-ROM drive or internet connection (for installation)
- USB Interface 2.0 or higher (for licence CmStick dongle)
- CmActLicences NOT on virtual maschines
1x Floating Network License
569,42 €
incl. VAT
365 days rent
- Free support
- Always current versions
- CmCloudContainer
- Supports virtual PCs
- Automatic license distribution
- Access via network/VPN
- Ends automatically
- Access for teams
1x Non-Network License
379,61 €
incl. VAT
365 days subscription
- Free support
- Always current versions
- License binding to PC
- One program user
- Automatic renewal
- Annually cancelable
1x Floating Network License
264,00 €
incl. VAT
10h PayPerUse
- All GGU applications included
- Free support
- Always current versions
- License binding to PC, CmCloudContainer or Dongle (CmStick with serial numbers starting with 3-344xxxx)
- Access via network/VPN
- Usage time by the minute
- All programs included
- Ends automatically
- Ideal for home office and license usage spikes